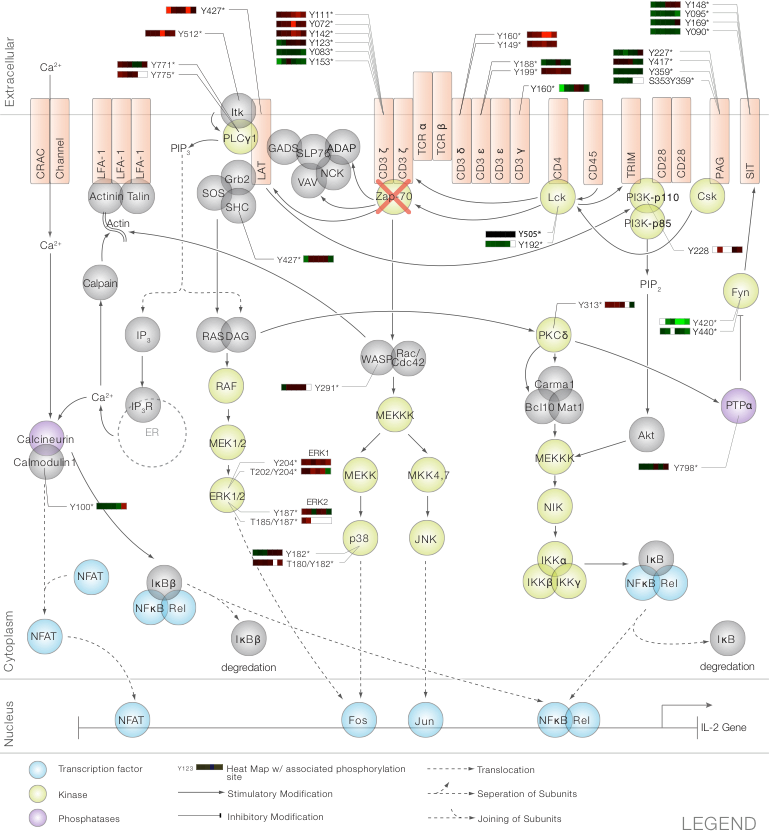
Figure 1: Canonical TCR signaling pathway. Established signaling cascades in activated T cells with quantitative Zap-70 null/Zap-70 reconstituted SILAC ratio data represented as heatmaps beside individual proteins. Heatmaps represent average of 5 replicate experiments. In the heatmap representation, green represents elevated phosphorylation in response to Zap-70 removal, while red represents a decrease in phosphorylation in response to Zap-70 removal. Black represents no change. Blanks in the heatmap indicate that a clearly defined SIC peak was not observed for that phosphopeptide in that time point. The utility of this visual representation is validated by the large number of red heatmap bars downstream of Zap-70 in the canonical pathway. Note that the * next to the phosphorylation site signifies that this site previously has been described in the literature.